POSTS
Data Preparation
The first step in my analysis is to collect Strictly data. Fortunately a lot of the hard work has been done for me by dedicated Strictly fans!
Anyone who has spent time on Wikipedia will not be surprised to hear the encyclopedic collection of Strictly data available there. There’s not only all of the scores for all 16 series, but also information like the highest and lowest score for each dance, for each series.
But it gets even better! Ultimate Strictly, which is a key source for the Wikipedia data, also maintains a detailed record of all scores and dances. And finally, there’s a conveniently tabulated form of all the Strictly dances and scores maintained at https://four-tens.github.io/ (whose name I only now got…), with the source CSV files hosted on a companion Github repo and licensed under CC-0. There’s also a data validation script, which is reassuring to see. According to the repo, “This data was initially sourced and collated from Ultimate Strictly (link to their excellent source page), manually sanitised and normalised, with additional data sourced from Wikipedia.” Sounds like a good start!
I downloaded a copy of results.csv and took a look:
url = 'https://raw.githubusercontent.com/four-tens/strictly-come-dancing-results/master/results.csv'
df = pd.read_csv(url)
df.head(1)
Output:
        celebrity_id    professional_id     celebrity   professional    dance   song    series  week    running_order   score_craig     score_arlene    score_len   score_bruno     score_alesha    score_darcey    score_jennifer  score_donny     score_shirley   total
    0   0   0   Natasha Kaplinsky   Brendan Cole    Cha-cha-cha     Chain Of Fools   1   1   1   5   7   8   7   0   0   0   0   0   27
There’s the first row of data! I ended up adding the scores from the start of the current series 16 that were missing and did a few small consistency checks, mostly to make sure I didn’t accidentally add new categories to categorical columns via typos (e.g., potentially adding a dance with “Anton du Beak” instead of “Anton du Beke”):
df.celebrity.unique().size == df.celebrity_id.max()+1

df.professional.unique().size == df.professional_id.max()+1

df.dance.sort_values().unique()
I’m glad I did this, because I discovered one “Argentina Tango” that had to be corrected to “Argentine Tango”.
Next, I developed the following steps to finish working up the data:
1) First, I thought it might be helpful for a model to know when a performance was in, expressed as a fraction of an episode (normed_order), and similarly when a week was, as a fraction of a series (normed_week). Scores tend to go up over the course of a series, and it seems like the show’s producers tend to put the big routines at the start or end of an episode. Normalization helps account for there being different numbers of routines each week, and potentially different numbers of weeks in different series.
def calc_normed_order(df):
    '''calc normalized position in show order as Series.
    '''
    grouped_by_episode = df.groupby(['series','week'], as_index=False)
    normalize = lambda x : (x-1) / x.max() # want steps to be, e.g., 0, 0.25, 0.5, 0.75 (no 1)
    normed_order = grouped_by_episode.running_order.transform(normalize)
    return normed_order

def calc_normed_week(df, total_weeks=None):
    '''calc normalized week in series order.'''
    grouped_by_series = df.groupby(['series'], as_index=False)
    # by default, use data to determine total number of weeks in series
    if total_weeks == None:
        normalize = lambda x : (x-1) / x.max() # want steps to be, e.g., 0, 0.25, 0.5, 0.75 (no 1)
    # otherwise, use passed in value (helpful if series not complete)
    else:
        normalize = lambda x : (x-1) / total_weeks
    normed_week = grouped_by_series.week.transform(normalize)
    return normed_week

df['normed_order'] = calc_normed_order(df)
df['normed_week'] = calc_normed_week(df)
2) Scores from judges not present in a given episode were given as “0”. I replaced that with NaN.
score_columns = df.columns[[x[:6]=='score_' for x in df.columns]]
score_columns_dict = {y:0 for y in score_columns}
score_and_total_cols = score_columns.append(pd.Index(['total']))
df.replace(score_columns_dict, np.nan, inplace=True)
3) Finally, I wanted to limit the analysis to when there were only four judges. Occasionally there have been five judges on the show, and I didn’t want that to confound the analysis. (It also has the helpful side effect of minimizing the effect of another confound, the “Donny 10”!)
df['num_judges'] = df.loc[:,score_columns].notna().aggregate(sum,axis=1)
df_4judges = df.query('num_judges==4')
I discovered this also dropped a few rows with total score 0, because all judge scores were missing. I checked Wikipedia and saw these scores were correctly missing: they were either unscored show dances from the end of series finales, or bye weeks due to celebrity injuries.
So with that, I’m ready to use this data to construct a model to predict a dance’s score!
More on that next time. The last thing for now: a pairplot I made using seaborn as a final visual check for no anomalous score values. Unsurprisingly, you can see all judges’ scores (I didn’t realize there have been so many!) are positively correlated.
donny_free = score_and_total_cols.delete([7]) # sorry, Donny...
sns.pairplot(df_4judges[donny_free], dropna=True, diag_kind='kde')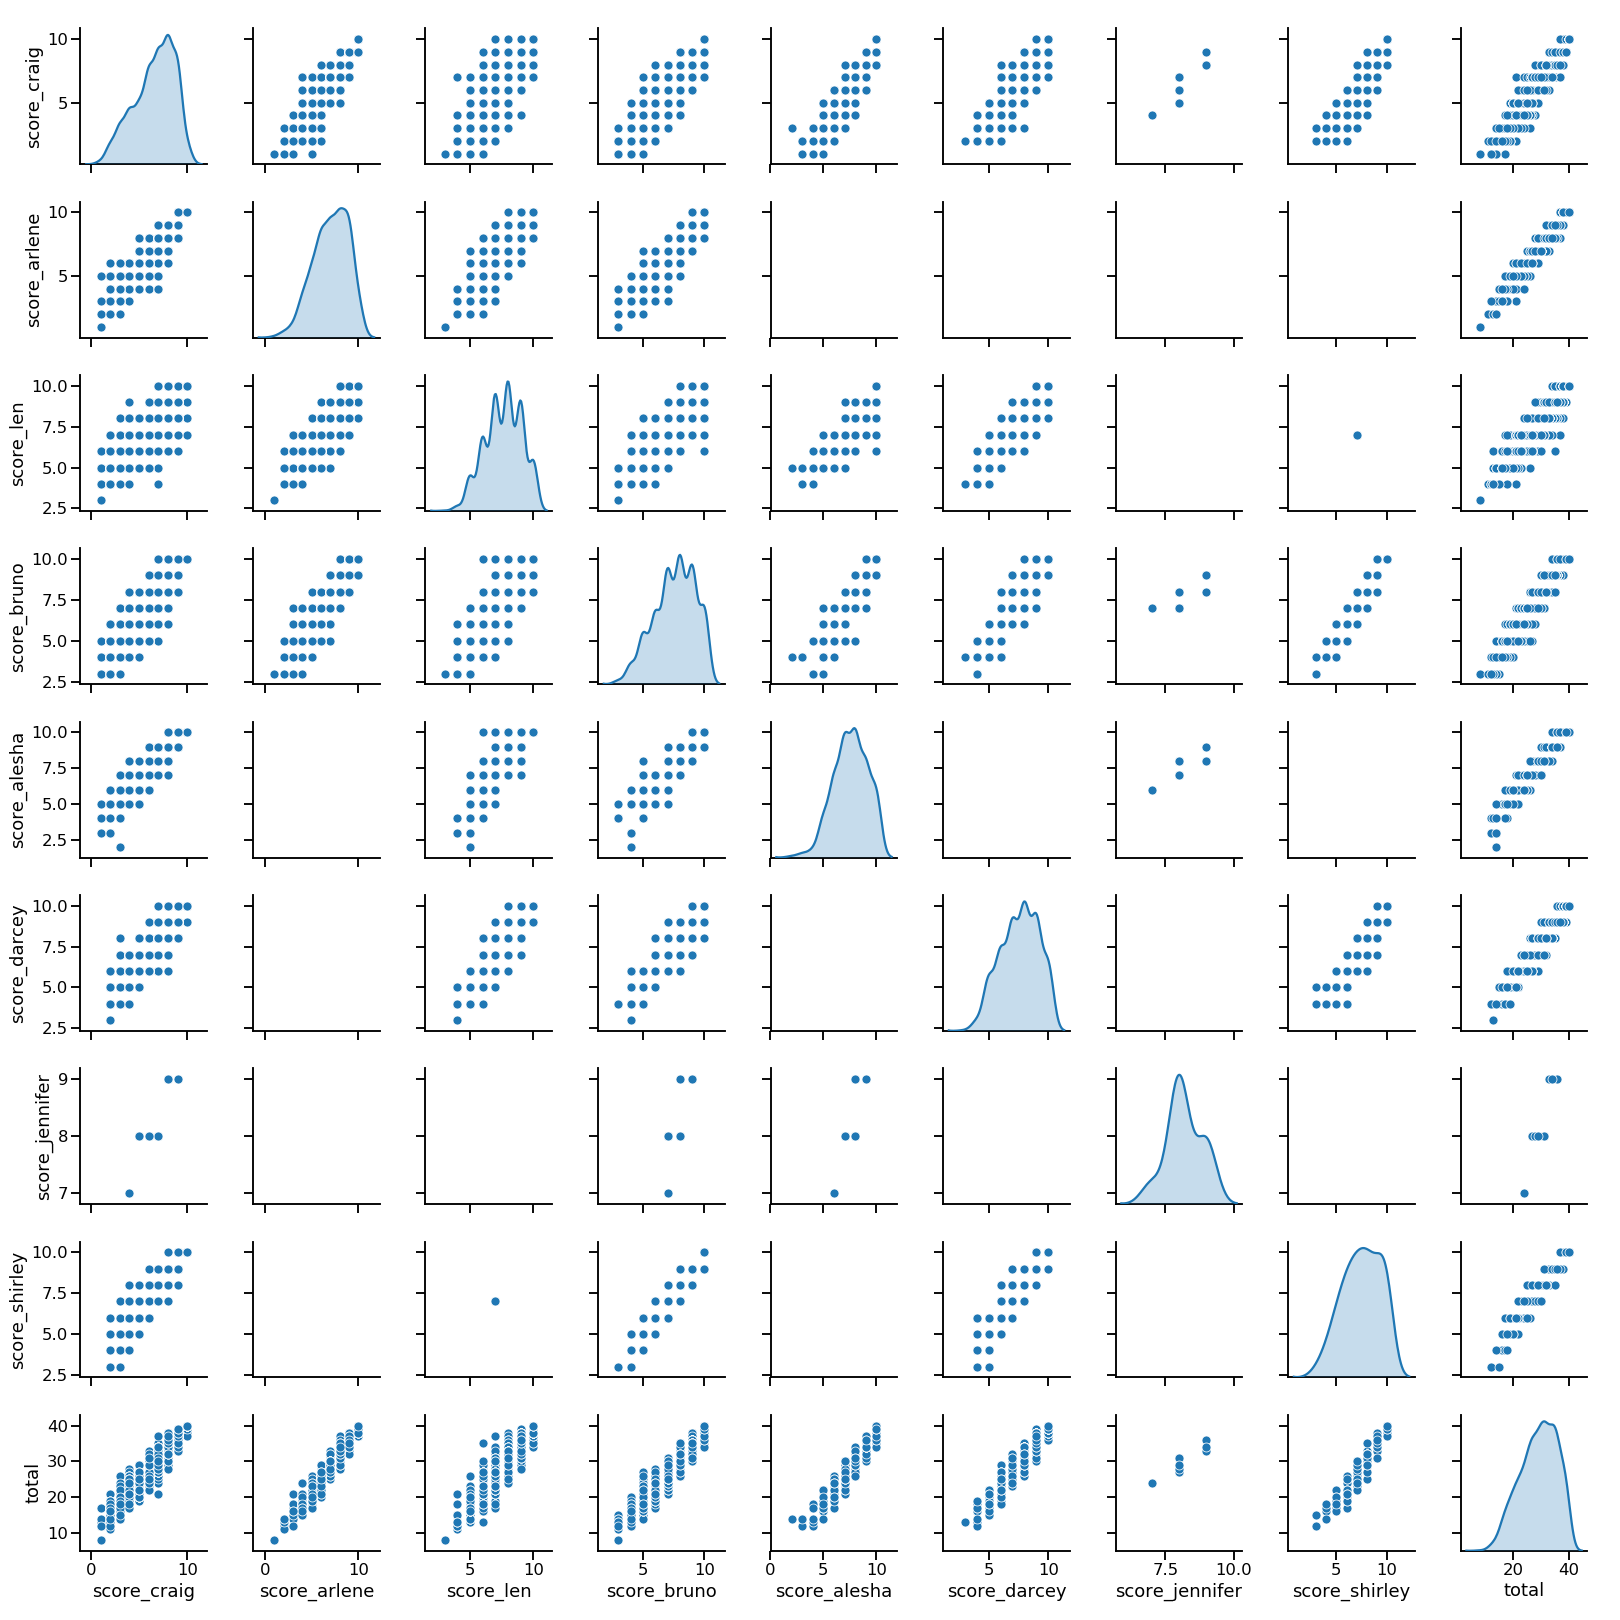
And remember: Keeeeeeeeeeeeeeep data-ing!